Company Views
The Company Views pages are the most frequently used pages in our solution. They contains different tables and graphs that show financial figures and ratios of the company in question and tools to change a companies data, view how certain ratios are calculated, generate automatic reports and more.
Here the company views subsections are explained in detail, one functionality of at a time.
Contents
Tabs
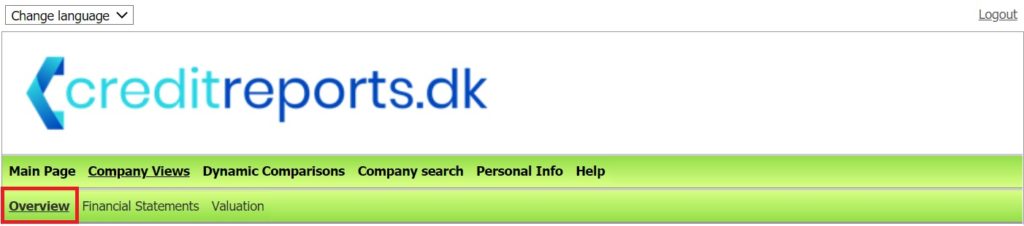
The company views have many different sub-pages that have different purposes. The pages can be accessed from the ribbon under the Company Views section. Here we will explain the purpose of the most commonly used pages in our system.
Overview
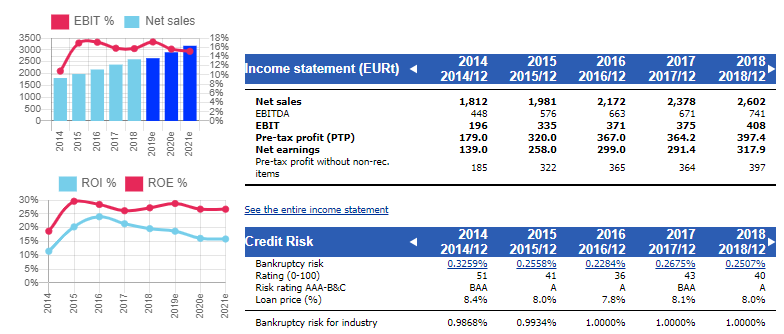
The Overview page is perhaps the most important section of the company views pages. It contains numbers and graphs about the most important variables of a company to get a good first impression of the company.
The page is divided into tables that summarize some aspect of the company, such as its income statement, balance sheet, profitability or solvency.
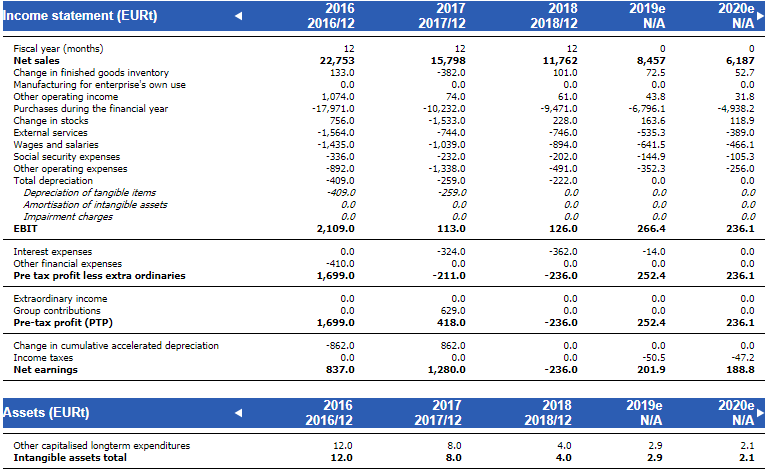
Financial statements
Another important sub-page of company views is The Financial Statements page, which contains both historical and estimate data of the company. It is split into three sections: income statement, assets and equity & liabilities.
All raw data of a company is visible here, meaning that ratios and other variables that are derived from this raw data is not shown here. Note that this page can change depending on what company you are viewing because rows can be hidden if they do not contain any data. For example, if a company does not have any assets that are classified as ‘Machinery and equipment’, this row will not be visible on the company’s Financial Statements page.
Other pages
Company views also include custom pages created to meet the needs of different customers. These include, for example, Valuation, Graph collections or Cash Flow statement pages. These pages are visible depending on each customer’s needs, so they will not be explained in detail here. If you need assistance with these pages, pleases contact our support.
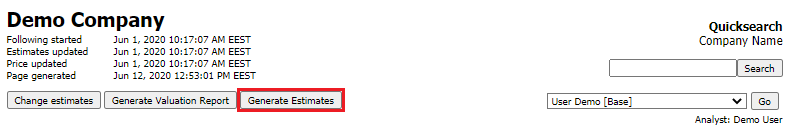
Generate estimates
You can generate automatic estimates for a company by pressing the ‘Generate Estimates’ button on company views pages. After pressing this button, a window appears where you can opt to keep the estimates for years of your choosing. This can be useful for instance if you have already made estimates for a couple of years and want automatic estimates only for later years. Notice that once you click the ‘Confirm’ button the estimates will be generated, and you cannot recover previous estimates for that scenario. For more information on how the automatic estimates are generated, see this page.
Scenarios
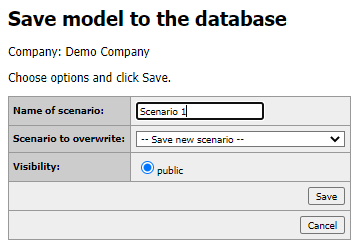
In the Valuatum system, you can make different scenarios for the same company for example if you want to create an analysis for the company for both a bull and bear scenario. You can create different scenarios by using the Change Estimates functionality found from the company views pages, and saving the scenarios with appropriate names. Just make sure that you have selected the ‘Save new scenario’ from the drop-down menu; otherwise the scenario selected in this menu will be overwritten.
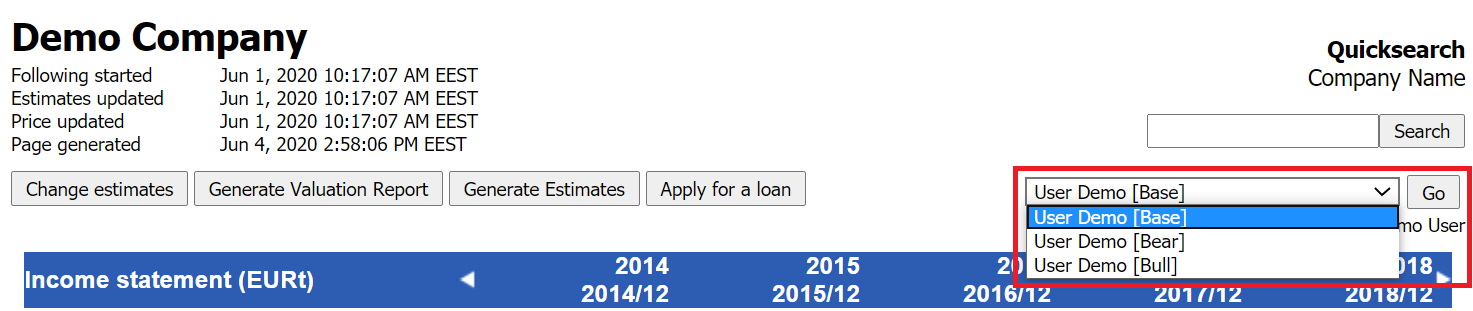
You can view all the scenarios visible to you from the drop-down menu under the search bar on the page of the company in question. Select the scenario and press ‘Go’ and that scenario will be loaded onto the page.
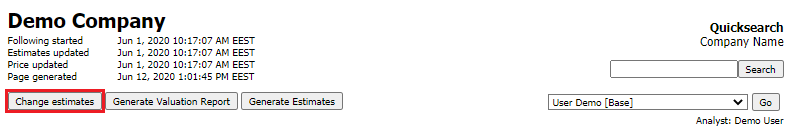
Change estimates
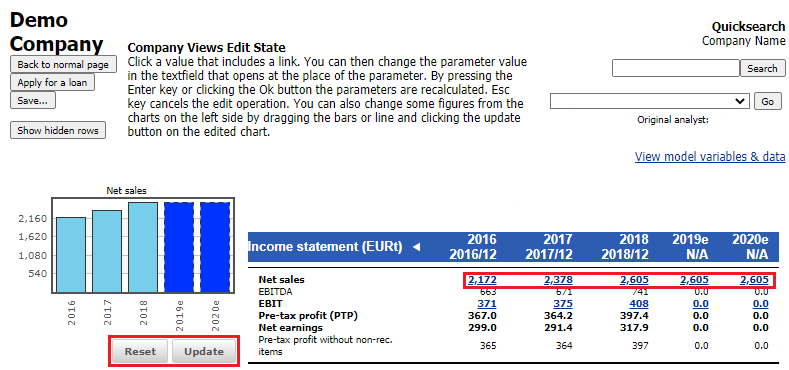
The company views comes with a Change Estimates functionality, which is a way to edit a company’s financial information. You can enter the Change Estimates functionality by pressing the button when you are on the Company Views page of the company that you want to edit.
When you are in the Change Estimates mode, all the variables that can be edited are shown in a blue font. To edit these variables simply click on the value, type in the new value and either press enter or click on the green check mark.
Some graphs can also be edited in the Change Estimates mode and you can identify these editable graphs by the ‘Reset’ and ‘Update’ buttons that are visible underneath the graphs in the Change Estimates mode. You can drag the values on these graphs to the value of your choosing, and when you are done pressing the ‘Update’ button will make these changes to the variable in question. Note that pressing the ‘Update’ button will not saving anything, so if you wish to undo the changes after pressing this button simply exit the Change Estimates mode.
The Change Estimates functionality works in a way that variables are linked to each other. For example, if you change the net sales of a company, this will affect its EBIT and net earnings or if you change some values in the company’s balance sheet, this will affect its balance sheet total. Calculating all the variables that might be affected by changing some variable can take time, and thus some values can change will the red warning is visible at the top of the page. Once this warning is gone, no other values will be automatically changed before you change some value again.
If you want to insert values into variables that were previously zero, you can unhide these hidden rows by pressing the ‘Show hidden rows’ button.
We recommend that when inserting estimates, you insert the estimates in the order that the variables are on the page. This is because for example if you first input the EBIT of a company and then input its net sales, the you just inserted will change. Additionally, some changes in the income statement will have effects on balance sheet parameters, so it is better to insert the income statement values before the balance sheet values.
Balance sheet balancing
The Change Estimates functionality also has an automatic balance sheet equalizer, so the assets and equity & liabilities will always match each other. Notice that this is only enabled for estimate years, since historically these should always be equal. The balancing functions differently when there are more assets than when there are more equity & liabilities.
Assets are greater than liabilities
When the assets of a company are greater than its liabilities, our system balances the two by generating debt for the company. The generated debt is added to the variables ‘Non-current loans from credit institutions’ and ‘Current loans from credit institutions’. The relative size of these variables can be controlled from the Estimate Parameters. You can also set a minimum level for each of these variables from the Estimate Parameters. If minimum levels are set, then these variables will always have this amount of debt regardless of other parameters or if the balance sheet sides are equal.
If after the minimum levels are set the balance sheet sides are still no equal, more debt must be generated. The generated debt is allocated according to the parameter ‘Share of generated debt allocated to long-term debt’; the percentage of additional debt required indicated by this parameter is added to ‘Non-current loans from credit institutions’ and the rest of the additional debt is added to ‘Current loans from credit institutions’.
If after the minimum levels are set the liabilities are larger than assets, the balance sheet is balanced according to the ‘Liabilities are greater than assets’ section below.
Keep in mind that the parameter that sets the share of generated long-term debt only sets the share of generated debt that is allocated to long-term debt after the minimum levels are reached. So it does not define the share of long-term debt to short-term debt, only the share of generated long-term debt to generated short-term debt.
Let us use an example where there are more assets than liabilities. Here the minimum amount of non-current debt is set to 300, the minimum amount of current debt is set to 200 and the share of generated long-term debt is 60%.
| Before | After | ||
| Assets total | 1000 | 1000 | |
| Liabilities total | 800 | 1000 | (= 300 + 420 + 280) |
| Others | 300 | 300 | |
| Non-current loans from credit institutions | 300 | 420 | (= 300 + 60% x 200) |
| Current loans from credit institutions | 200 | 280 | (= 200 + 40% x 200) |
The difference between the balance sheet sides is 200, so 60% of this is allocated to non-current debt, which brings the total to 300 + 60% x 200 = 420. The rest of the generated debt is allocated to current debt, bringing the total to 200 + 40% x 200 = 280.
Liabilities are greater than assets
When liabilities are greater than assets, the equalizing process is significantly easier. The difference is simply added into the variable ‘Cash (generated)’.
Here is an example where the difference between liabilities and assets is 200, like in the previous example.
| Before | After | |
| Assets total | 800 | 1000 |
| Others | 600 | 600 |
| Cash and bank deposits | 200 | 200 |
| Cash (generated) | 0 | 200 |
| Liabilities total | 1000 | 1000 |
Estimate parameters
Estimates can be changed by changing the variables in a company’s financial statement and balance sheet one by one, but often it can be easier to change estimates by using Estimate Parameters. You can find the Estimate Parameters on the Financial Statements page under the financial statement and balance sheet sections.
Income statement parameters
There are three parameters that affect income statement estimates: net sales growth, EBIT percent and depreciation percent.
Net sales growth directlyaffects net sales, as net sales for estimates is calculated by adding net sales growth to the previous years net sales. Changing the net sales growth for an estimate year has a direct effect on net sales: net sales is recalculated so that it matches the new net sales growth value. Similarly changing net sales will cause net sales growth to be recalculated so that it matches the new value.
Changing net sales growth also has an indirect effect for the net sales of other estimate years, since the net sales of the next year is calculated using the previous years net sales. So changing net sales for one estimate year will recursively change the net sales for the estimate years that are after the changed year. This is why it is recommended to create estimates starting from the first estimate year and working your way further.
EBIT percent works similarly to net sales growth; changing the EBIT percent will change EBIT and vice versa. When EBIT is changed, all the values between EBIT and net sales, excluding depreciation and amortization, are changed so that net sales minus costs sums up to EBIT.
Depreciation percent directly affects the value of tangible assets in the balance sheet. Tangible assets are calculated by summing together the previous years tangible assets and subtracting depreciations from this. For example, if a company has tangible assets worth 300 in their balance sheet, they invest 50 and depreciation percent is 30 % they will have (300 + 50) * (100% – 20%) = 280 worth of tangible assets during the next period. When changing the depreciation percent, the change is done so that the relative size of each tangible asset to total tangible assets remains the same. When changing a single tangible asset, the depreciation percent of the total tangible assets remains the same and investments into tangible assets are changed as needed. The functioning of investments will be explained in more detail in the next section.
Investments into tangible assets
Tangible assets can be edited by directly changing the value of each variable, by changing investments or by changing the ratio of tangible assets to net sales. No matter how the changes are made, the balance sheet will always be equalized (this is explained in the section Balance Sheet Balancing).
How changes affect other variables
If some component of tangible assets, such as buildings, is directly changed, the amount of the change is added to (or subtracted from) investments into tangible assets. The ratio of investments to net sales is also updated accordingly. The change is also transferred to future fiscal years, since it is reasonable to assume that tangible assets are used for longer than one period. The value of investments is then depreciated over time.
If total investments are changed (either the absolute total investments or the investments to net sales ratio), each component of tangible assets is calculated again in such a way that their sum changes the amount the total investments change and the relative size of each component to total tangible assets stays the same. If the ratio of tangible assets to net sales is changed, the value of the components of tangible assets are changed to match the ratio. Additionally, investments are changed so that they reflect the changes made to the components. Like in the previous case, in this case the relative size of each component to total tangible assets stays the same.
How changes affect future fiscal years
When estimates are changed, the effect of changes in tangible assets on future fiscal years are handled a little differently depending on the case. If some component of tangible assets is directly changed, the result will follow the logic describes in the section above: direct changes to the balance sheet always dominate estimate parameters, so the investment and tangible asset ratios to net sales for each year are changed to match the amount of tangible assets for that year.
In other cases, the value of the variables is dependent on whether the ratio of tangible assets to net sales is set to be dominant. This is set by the variable ‘Is Tangible assets % dominating?’. By default, investments are set ad dominating for the first two estimate years, and tangible assets percent is set as dominating after that.
If tangible assets percent dominates (‘Is Tangible assets % dominating?’ is set to 1) the tangible assets of the fiscal years after the changed year do not change. Instead, investments are changed to that the ratio of tangible assets to net sales can be maintained. When net sales is changed, tangible assets are changed with the same proportion as the change in net sales. Additionally, depreciation is compensated by increasing absolute investments with an equal amount.
If tangible assets percent does not dominate (‘Is Tangible assets % dominating?’ is set to 0) tangible asset are calculated based on the previous year’s tangible assets and investments. In this situation, a change in net sales does not affect tangible assets. Depreciations are subtracted from the value of tangible assets.
Working capital parameters
Working capital and its ratio to net sales is an important factor in a company’s day-to-day operations. A company can define a minimum level of working capital required to ensure the continuity of operations in the short-term. The amount of required working capital is dependent on the extent of a company’s operations, and therefore some working capital figures and their ratios to net sales are useful when analyzing the structure of a company’s balance sheet.
For some components of working capital, their value can be defined by manipulating their ratio to net sales using estimate parameters. Such components are raw materials, semifinished products, finished goods, trade receivables, non-current trade debtors and current and non-current trade creditors. For example, if the ratio of raw materials to net sales is set at 5%, the value of raw materials in the balance sheet will change as net sales changes so that this ratio is maintained. Also if the ratio is changed to 10%, the value of raw materials in the balance sheet will change to accommodate the ratio.
Like other variables, the components of working capital can be directly changed in the balance sheet. In this case, the ratio of the component to net sales is re-calculated to match the new value of the component. When making changes to working capital, the last change stays in effect regardless of whether the change was made to the component’s ratio to net sales or to the component itself. Changes to working capital do not however carry forwards to future fiscal years, but changes to working capital need to be made year-by-year. Estimates to receivables and current assets that do not have estimate parameters can be edited by directly changing the value of the desired variable.
Debt and cash parameters
The parameters under the title ‘Debt and cash parameters’ control how debt and liquid assets are generated, and they have an important role in the balancing of the balance sheet. They are explained in more detail in the Balance sheet balancing section above.
Other parameters
Parameters that do not fit into other sections are listed here. These parameters are payout ratio and tax rate.
Payout ratio defines how much of a company’s retained earnings is payed out to shareholders as dividends and how much of the retained earnings stays within the company (and thus included into its equity). The effect of the payout ratio is observable in the variable ‘Retained earnings’ in the equity section; it is the product of the profit of the previous fiscal year and the ratio of that is not payed out as dividends. For example, if in 2018 the profit of the previous fiscal year is 1000, the profit for the current year is 200 and the payout ratio for 2019 is 75%, retained earnings for 2019 is calculated the following way.
| 2015 | 2016 | ||
| Retained earnings | 1000 | 1150 | (= 1000 + 200 x (100% – 25%)) |
| Profit of the fiscal year | 200 | 300 | |
| Payout ratio | 30% | 25% |
Notice that the payout ratio affects how much of the profit from the previous fiscal year stays within the company. For example, if you wish to set how much dividends are payed out form the profit of 2018, you need to change the payout ratio of 2019.
Tax rate works in such a way, that changing this value simply changes the amount of taxes the company pays. Similarly, changing the amount of taxes paid changes the tax rate so that the tax rate matches the amount of taxes paid.
Saving
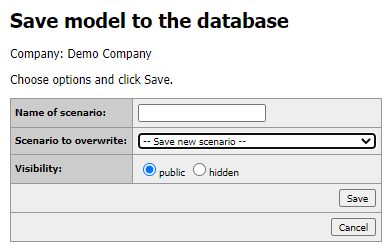
Once you are done editing a company’s financials, you can save the changes by pressing the ‘Save’ button. Here you can give this scenario a name (this is optional, choose whether you want this scenario to be visible to others and choose if you want to save a new scenario or overwrite a previous scenario. Note that before doing this saving action, no changes that you make in the Change Estimates mode will be saved. If you wish to undo changes you have made, simply exit the Change Estimates mode by pressing the ‘Back to normal page’ button before saving.
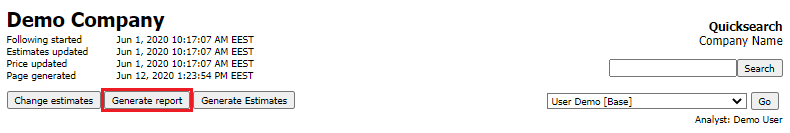
Generate reports
You can generate automatic reports for a company on the company views pages by clicking the ‘Generate Reports’. Here you can choose the report type, the reports language. You can also choose the format of the report from PDF or a Word document if you need to edit the report. If you choose a PDF report, it will open in a new tab in your browser and if you choose a Word document, it will be downloaded.
You can also find a video tutorial about the report generation from our platform tutorials page.
Formula display
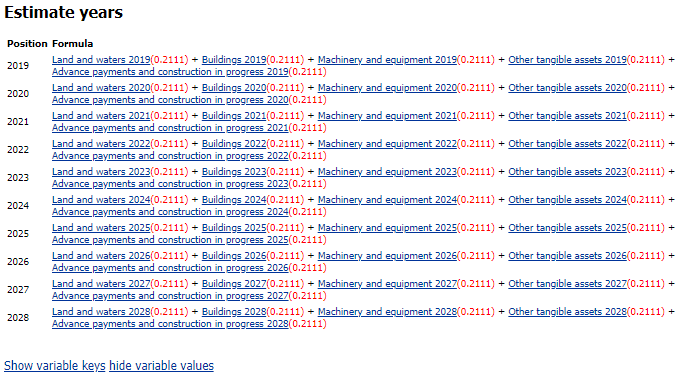
When you have a company views page of some company open, clicking on any variable in the various tables will open a Formula Display pop-up window. This functionality is useful to check or better understand how some variable is calculated.
The first part of the formula display shows settings for that variable. After these, the formulas for the variable are shown for history years and estimate years separately. This is because often the formula for history and estimate years can be different. If the variable is not an input value and it is calculated using other variables, you can click on these variables in the Formula Display to see how they are calculated.
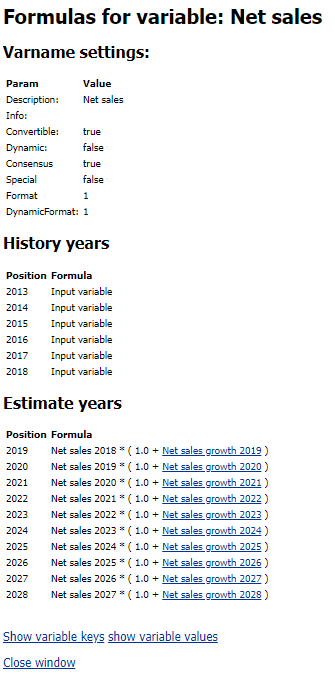
On the bottom of the formula display, there are two buttons: ‘Show variable keys’ and ‘Show variable values’. The first button shows what the variable is called internally in the Valuatum system. The second button fetches the values of each variable in the Formula Display window and shows them in brackets next to the variable. For example the variable Tangible assets total is a sum of the variables Land and waters, Machinery and equipment, Other tangible assets and Advance payments and construction in progress so the ‘Show variable values’ button will show the values of each of these components.