Comparisons
The Valuatum system has tools to compare different things, such as companies, values of different variables and industries. These tools are split into two groups: Comparisons and Dynamic Comparisons.
Contents
Dynamic XY scatter
On this page, you can plot companies onto a scatter graph according to variables and value ranges of your choosing. Choosing the variables is self-explanatory: you add variables from the ‘Add new criteria’ button and you set the minimum and maximum values for each variable. By clicking the ‘Apply filters’ button the scatter graph is drawn and a list of companies that match the criteria is shown underneath the graph. For a scatter graph to be drawn, you need to add two criteria. You can add more if you like, and the additional variable values will be shown in the list but naturally not in the scatter graph. If you want to use the criteria later, you can save them by clicking the ‘Save current criteria’ button. Then you can easily access these criteria from the drop-down list on the top left corner of the page.
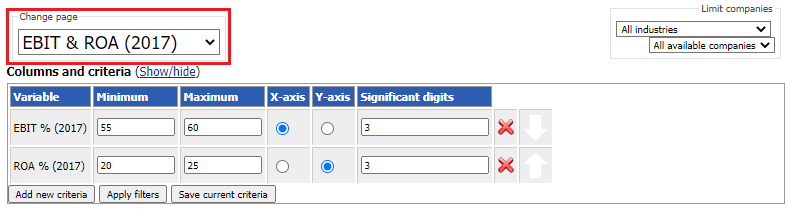
If want to filter companies by industry, you can do that from the drop-down menu on the top right corner of the page.
You can view the values of the selected variables of a company by hovering over the dot of the wanted company on the graph. You can go to the company’s page by clicking the dot or by clicking the company’s name in the list.
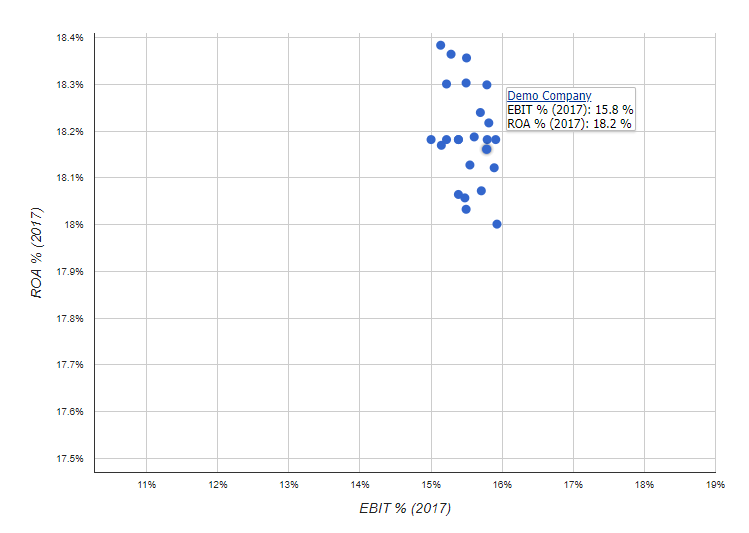
You can also change move around in the graph. You can zoom in and out of the graph by hovering your mouse over the graph and scrolling (down for zooming in and up for zooming out). You can also drag the graph around to view different parts of it.
By default, the companies are listed in descending order according to the first criteria. This can be changed by clicking the variable names in the list header: clicking a variable will sort the list in descending order according to that variable and clicking the variable again will sort the list in ascending order.
Dynamic rankings
This page is essentially the same as the Dynamic XY Scatter, but it contains only the list of companies and not the scatter graph.
Choosing the variables works the same way: you add variables from the ‘Add new criteria’ button and you set the minimum and maximum values for each variable. By clicking the ‘Apply filters’ button the list of companies that match the criteria is shown. If you want to use the criteria later, you can save them by clicking the ‘Save current criteria’ button. Then you can easily access these criteria from the drop-down list on the top left corner of the page.
If want to filter companies by industry, you can do that from the drop-down menu on the top right corner of the page.
By default, the companies are listed in descending order according to the first criteria. This can be changed by clicking the variable names in the list header: clicking a variable will sort the list in descending order according to that variable and clicking the variable again will sort the list in ascending order.