Credit Risk Model Overview
On this page, we will walk you through how our credit metrics are calculated using our AI-powered credit risk model XGBoost, exploring its theoretical foundation and demonstrating why it stands out as the most accurate and reliable solution on the market. Built on the XGBoost machine learning framework, our model outperforms traditional methods by assessing each company’s unique risks, enabling lenders to reduce potential credit losses by up to 50-60% (see Section 3.2).
Section 1 provides an introduction to the XGBoost model, explaining how it analyzes financial variables to assess risk. Section 2 breaks down the theoretical principles that make our approach superior to traditional models. Supporting this, AI models have consistently outperformed conventional techniques in numerous academic studies (see Section 3.1). Our extensive testing (see Section 3.2) confirms that our model excels at identifying high-risk companies, allowing you to lend only to trustworthy businesses. This leads to fewer defaults, reduced financial risk, and significant cost savings for your business.
Our platform leverages this advanced risk assessment to calculate bankruptcy risk and convert it into practical tools, such as credit ratings and limits, to help businesses make informed financial decisions (see Section 4).
Indhold
- The XGBoost model
- Theoretical motivation behind XGBoost
- Empirical results of XGBoost model
- Calculation methods of our parameters
1. The XGBoost model
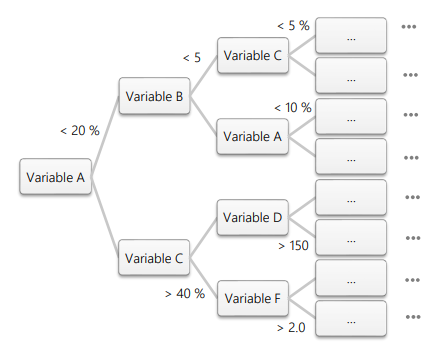
The XGBoost model, short for eXtreme Gradient Boosting, is a machine learning algorithm widely recognized for its superior performance in predictive modeling, particularly in the field of credit risk assessment. XGBoost is built on a decision tree algorithm, where data is split at various points, starting from a single root and branching out based on specific conditions. For example, the first decision might be based on a financial metric like “Is net sales > 30 million DKK?” If the answer is “yes,” the tree might then branch off to another question, such as “Is the debt-to-equity ratio below 0.5?” Each decision splits the data into smaller, more specific groups, eventually leading to a final prediction at the “leaves” of the tree, which are the endpoints of the branches (see Image 1 below for a simplistic representation of a decision tree).
In XGBoost, instead of relying on a single decision tree, the algorithm builds an entire “forest” of trees, where each new tree is designed to correct the errors made by the previous ones. This ensemble approach allows XGBoost to make very accurate predictions by learning from its mistakes and refining its decisions at each step. The model then aggregates the results from all these trees to make the final prediction. This method allows the model to learn from complex patterns within the data, making it highly effective for tasks such as predicting bankruptcy risks.
Our XGBoost model leverages over 30 different financial statement variables to assess credit risk. These variables are selected based on their relevance to a company’s financial health and their predictive power in bankruptcy risk modeling. Among the key variables used are:
- Kapitalandel: This ratio measures the proportion of a company’s assets that are financed by shareholders’ equity. A higher equity ratio indicates a stronger financial foundation, as it suggests the company relies less on debt. This metric is crucial for understanding the long-term solvency and stability of a business.
- ROA-% (Return on Assets): This ratio assesses how efficiently a company is utilizing its assets to generate profit. It serves as a critical indicator of overall financial performance, providing insights into how well management is using the company’s assets to produce earnings.
- Hurtigforhold: Also known as the acid-test ratio, this metric evaluates a company’s ability to meet its short-term obligations with its most liquid assets. A higher quick ratio indicates better liquidity, suggesting that the company can quickly cover its current liabilities without needing to sell inventory.
Our variables are chosen from a pool of hundreds of potential options, selected for their superior predictive power according to various metrics such as PR-AUC and ROC-AUC (see Section 3.2 for more on our results and performance metrics). Most of the variables we have chosen measure the company’s profitability, liquidity, solvency, indebtedness, size, or operational efficiency.
Vores modeller er udviklet i samarbejde med Valuatum. Du kan finde mere detaljeret information om dem på Valuatums hjemmeside:
- Vores løsning i en nøddeskal – fremhæver fordelene ved at bruge maskinlæringsmetoder og skitserer vores tilgang til at imødegå manglen på forklarlighed i modelbeslutninger
- Konkursrisikooversigt – giver indsigt i vores models arkitektur, de anvendte variabler, dens træningsproces og meget mere
- Hvidt papir – detaljeret teknisk forklaring af vores model
2. Theoretical motivation behind XGBoost
Our AI-powered credit risk model, built on XGBoost, is designed to optimize both predictive accuracy and efficiency, making it a powerful tool for assessing credit risk. Compared to older, traditional methods, XGBoost has proven to consistently outperform due to several key differences in its design.
Why is XGBoost better?
- Dynamic variable weights: Traditional models use a fixed formula to assess risk, meaning every company is judged in the same way. XGBoost, however, is more flexible. It adjusts the importance of financial variables like liquidity ratios or debt levels based on the specific situation of each company. This leads to more accurate predictions tailored to each business. See Example 1 below.
- Number of model variables: XGBoost supports the use of a large number of variables without losing predictability. In contrast, traditional regression models struggle when faced with a large number of variables. Increasing the number of variables often leads to unstable predictions and overfitting. To avoid this, traditional models typically rely on just a few key variables, but this approach can result in removing important factors. See Example 2 below.
- Robustness to outliers: In simpler models, a few unusual data points (outliers) can throw off predictions. XGBoost is more resilient to this. It can detect when a company’s financial data is unusual and adjust accordingly, meaning predictions remain reliable even when some numbers are extreme.
While XGBoost is incredibly accurate, machine learning models can sometimes be seen as “black boxes,” meaning it’s not always clear how they arrive at their decisions. Unlike traditional models where the role of each financial variable is clear, XGBoost’s decision-making process is more complex. To address this, we provide clear visualizations and automatic text summaries that explain the model’s decisions in a way that’s easy to understand. See Example 3 below.
Example 1: Dynamic variable weights
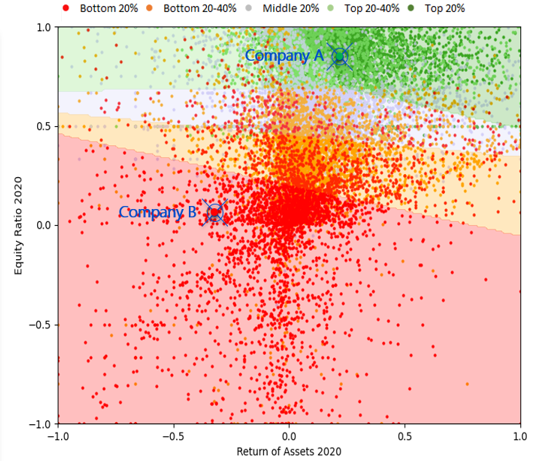
Company A has a very good solvency and profitability according to Image 2 on the right. Company B on the other hand has very poor solvency and it is unprofitable. When assessing their credit risk, these companies should have different weights for the explanatory variables like liquidity.
Here, Company A doesn’t need to have good liquidity since it is able to fund itself through its operations or by loaning money. On the contrary, Company B is losing money and can’t raise loans. The most important feature it has is its liquidity.
It can be clearly seen that varying weights are necessary for successful credit risk assessment. Logistic regression has constant weights and thus it is unable to account for these firm-specific characteristics. Machine learning algorithms on the other hand can recognize that the significance of liquidity becomes larger with unprofitable companies and will adjust its credit ratings accordingly.
Example 2: Number of model variables
Highlighted company in Image 3 has excellent profitability and a high equity ratio, along with other key variables like liquidity. A traditional logistic regression model, which only considers these main variables, would likely assess that the company is highly creditworthy.
However, a machine learning model can evaluate a broader range of variables. It might notice that the company’s sales receivables per net sales have been rising significantly in the last couple of years. This could indicate that a part of the receivables may not be collected, posing a risk to the company’s figures.
If this is the case, the actual profitability and solvency of the company can be significantly lower than it would seem at a first glance. Our AI model can automatically take this into account in its assessment. Traditional models need a credit risk expert to manually adjust the profitability and solvency figures to account for possible non-receivable items beforehand.

Example 3: Visualization & automatic text
Automatically generated text
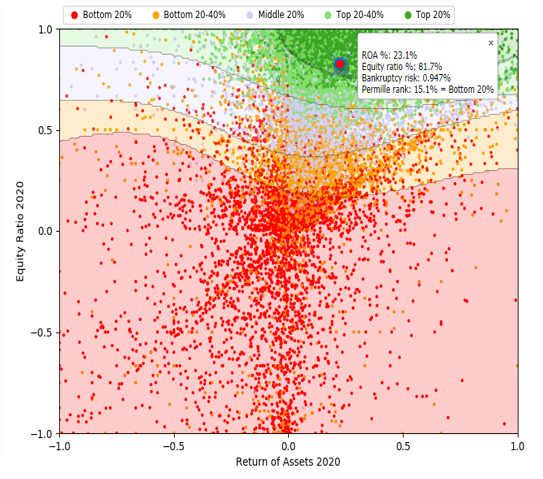
The company highlighted in Image 4 has excellent profitability and solvency. For example, in 2020, the ROA-% of Company X was 23.1 % and the equity ratio was at 81.7 %. The net sales in 2020 were 845 kEUR which represents a growth of 13.1% from the year before. While the company has excellent figures in these aspects, the credit risk model has rated the company much lower than other companies with similar profitability and solidity. The higher credit risk is a result of the following weaknesses identified by the model:
1. Increasing current loans receivable: From 2016 to 2020, current loans receivable grew from €22k to €186k, indicating that the company is lending out more money, which could result in bad debt if borrowers default.
2. Low cash and cash equivalents: The company has consistently low cash balances, with only €5k in cash at the end of 2020, which may make it difficult to cover short-term obligations or unexpected expenses.
3. High non-interest-bearing liabilities: In 2020, non-interest-bearing liabilities reached €68k, putting pressure on the company’s liquidity and potentially increasing bankruptcy risk if they are unable to pay off these liabilities.
Based on the above-mentioned factors, our credit risk model has assessed that the company has a high bankruptcy risk of 0.947 %, which corresponds to a credit rating of BB (poor).
Visualization
3. Empirical results of XGBoost model
While theory and model architecture are essential, the real proof of any model’s effectiveness comes down to how well it performs in practice. In this section, we present the empirical results that showcase the accuracy and reliability of our XGBoost-powered model. We’ve not only drawn from academic studies that demonstrate XGBoost’s superiority over traditional methods but have also conducted our own tests to verify its performance. These results highlight how our model provides more accurate predictions, helping lenders minimize credit losses and identify high-risk companies with greater precision.
3.1. Academic results of XGBoost
In this section, we highlight some academic studies that have demonstrated XGBoost’s exceptional performance in predicting default and bankruptcy risk. The following articles illustrate the model’s effectiveness and superiority over traditional methods. These studies collectively showcase XGBoost’s robustness, and accuracy, making it a leading choice for predicting financial distress and credit risk.
Article 1: “Bankruptcy Prediction using the XGBoost Algorithm and Variable Importance Feature Engineering” (Jabeur et al., 2023) (link)
This study, published in Computational Economics, explored the application of XGBoost to predict bankruptcy. The researchers found that XGBoost significantly outperformed traditional statistical models, such as logistic regression, by providing higher predictive accuracy. The model’s ability to handle imbalanced data – where bankrupt firms are much less common than non-bankrupt ones – was particularly emphasized. Moreover, the study highlighted XGBoost’s integrated feature importance capabilities, which offered valuable insights into the factors most strongly associated with bankruptcy.
Article 2: “A Boosted Decision Tree Approach Using Bayesian Hyper-Parameter Optimization for Credit Scoring” (Xia et al., 2017) (link)
This study, published in Expert Systems with Applications, is one of the first articles that utilized XGBoost model to credit modelling. The authors proposed an advanced credit scoring model based on XGBoost, enhanced through Bayesian hyper-parameter optimization. The results demonstrated that this model outperformed several baseline models, including random search and grid search optimizations, in key evaluation metrics such as accuracy, AUC (Area Under the Curve), and Brier score. The study emphasized that careful tuning of hyper-parameters using Bayesian optimization significantly boosts the performance of XGBoost, making it a powerful tool for credit risk assessment. Additionally, the model provided feature importance scores, which help in understanding the key factors driving the predictions, thereby enhancing the model’s interpretability.
Article 3: “Measuring the Model Risk-Adjusted Performance of Machine Learning Algorithms in Credit Default Prediction” (Robisco & Martinez, 2022) (link)
This research article, published in Financial Innovation, focused on the use of XGBoost for credit default prediction. The study concluded that XGBoost consistently outperformed other machine learning models, including support vector machines and logistic regression, in terms of accuracy. The article also pointed out that XGBoost’s predictions are not only accurate but also interpretable, thanks to techniques like SHAP (SHapley Additive exPlanations). This interpretability is crucial in financial contexts, where understanding the rationale behind predictions is essential.
3.2. Own test results of XGBoost
In addition to academic studies, we have examined our own model and compared the results to more traditional methods. We have observed that our model yields more accurate and better results than traditional models. We will present our findings using a few examples.
Comparison between our AI-rating vs. Logistic regression rating
This analysis showcases the effectiveness of our AI-rating model compared to a traditional logistic regression model commonly used by industry professionals. We use Finnish data due to the unavailability of industry-standard logistic regression data for Denmark. However, our findings will demonstrate that our model, when trained on Danish data, delivers even more precise estimates than when trained on Finnish data (see Expanding Analysis to Danish Data below).
In this comparison, we calculated the bankruptcy risk for 200,000 Finnish companies based on their 2021 financial statements using both our AI model and a logistic regression model. Companies were then divided into ten equally weighted risk groups (10% in each), ranging from ‘Bottom 10%’ to ‘Top 10%’ according to their assessed risk level. Companies in the ‘Bottom 10%’ group are identified as the riskiest, while those in the ‘Top 10%’ are deemed most creditworthy. Notably, different models can assign the same company to different risk categories.
To evaluate model performance, we focused on companies that went bankrupt in 2023, analyzing how each model had categorized them within the ten risk groups. This data is visually represented in the graph below.
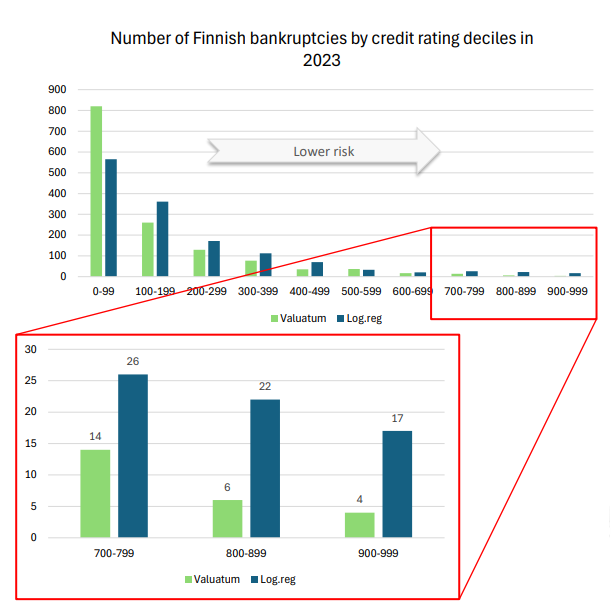
Both models show a concentration of bankrupt companies in the riskiest decile, demonstrating high predictive accuracy. However, our AI model outperforms by identifying over 200 more bankrupt companies in the ‘Bottom 10%’ group than the logistic regression model. This enhanced accuracy underscores our model’s ability to capture additional risk factors that traditional methods may overlook.
Lenders typically prioritize creditworthy companies, so the difference in predictive accuracy at the top end of the risk scale directly impacts potential financial losses. To illustrate, we have highlighted the top 30% of companies and examined their differences more closely. According to the logistic regression model, 65 bankrupt companies were classified within this top creditworthy group, compared to only 24 using our AI model. This difference underscores the AI model’s superior precision in identifying truly creditworthy companies.
To illustrate the practical impact, let’s assume a lender issued 10 billion euros in credit to the top 30% of companies based on their logistic regression model risk assessments. Of these, 65 companies subsequently went bankrupt, leading to a credit loss of approximately 25 million euros (0.25% of the issued credit). By contrast, if the lender had used our AI model, only 24 of those companies would have been classified in the top 30% — reducing credit losses by approximately 63.1%, or 15.8 million euros.
In summary, our AI model provides substantial advantages in predicting credit risk, offering lenders a more accurate tool to minimize financial losses by identifying potentially insolvent companies more effectively than traditional methods.
Expanding Analysis to Danish Data
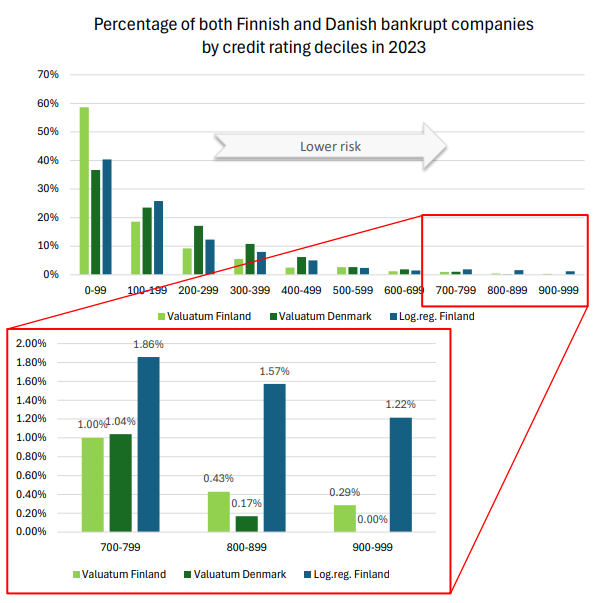
The following figure extends the previous analysis to Danish bankrupt companies, assessed using our AI model. Here, the y-axis shows percentages instead of absolute values to account for differences in the number of bankrupt companies between the Finnish and Danish datasets.
From this comparison, we observe that a smaller percentage of Danish companies in the Top 30% credit risk category went bankrupt (1.21% for Danish companies versus 1.72% for Finnish companies, as per our AI model). This finding underscores our model’s strong predictive accuracy with Danish data, reinforcing its robustness across different datasets.
Performance evaluation
We have also conducted a study to compare our model against several benchmark models. Studied models include XGBoost, random forest model, artificial neural networks, an ensemble method and logistic regression. Additionally, we compared our results with those reported by Altman et al. (2014) as a point of reference. A total of approximately 170 000 Finnish companies and 30 input variables were used in the training of the models. To ensure a fair evaluation, we split the data evenly, using half for training and half for testing.
In this study, we used the ROC-AUC metric to evaluate and compare model performance (see more on ROC-AUC and its interpretation her, for example). An ROC-AUC score closer to 1 indicates a model with stronger predictive ability, while a score of 0.5 suggests performance no better than random guessing. The ROC-AUC results across all models were as follows:
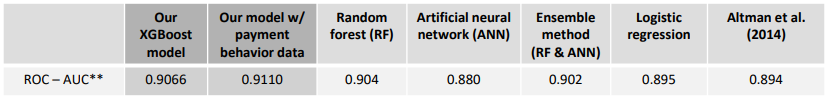
As the table shows, our XGBoost model outperformed all benchmark models, achieving the highest ROC-AUC score and underscoring its strong predictive accuracy. It also shows that our model can be further improved by adding payment behavior data into the model – a potential extra element that is not yet available in Denmark.
4. Calculation methods of our parameters
Understanding how we calculate our credit ratings, bankruptcy risk, and credit limits is crucial to appreciating the value of our model.In this section, we detail the methodologies behind these core metrics. By combining cutting-edge machine learning techniques with detailed financial data, our model provides more accurate and reliable assessments than traditional methods. Below, we explain our processes for assigning credit ratings and scores, estimating bankruptcy risk, and recommending initial credit limits, all to support lenders in making informed and effective credit decisions.
Kreditvurdering og score
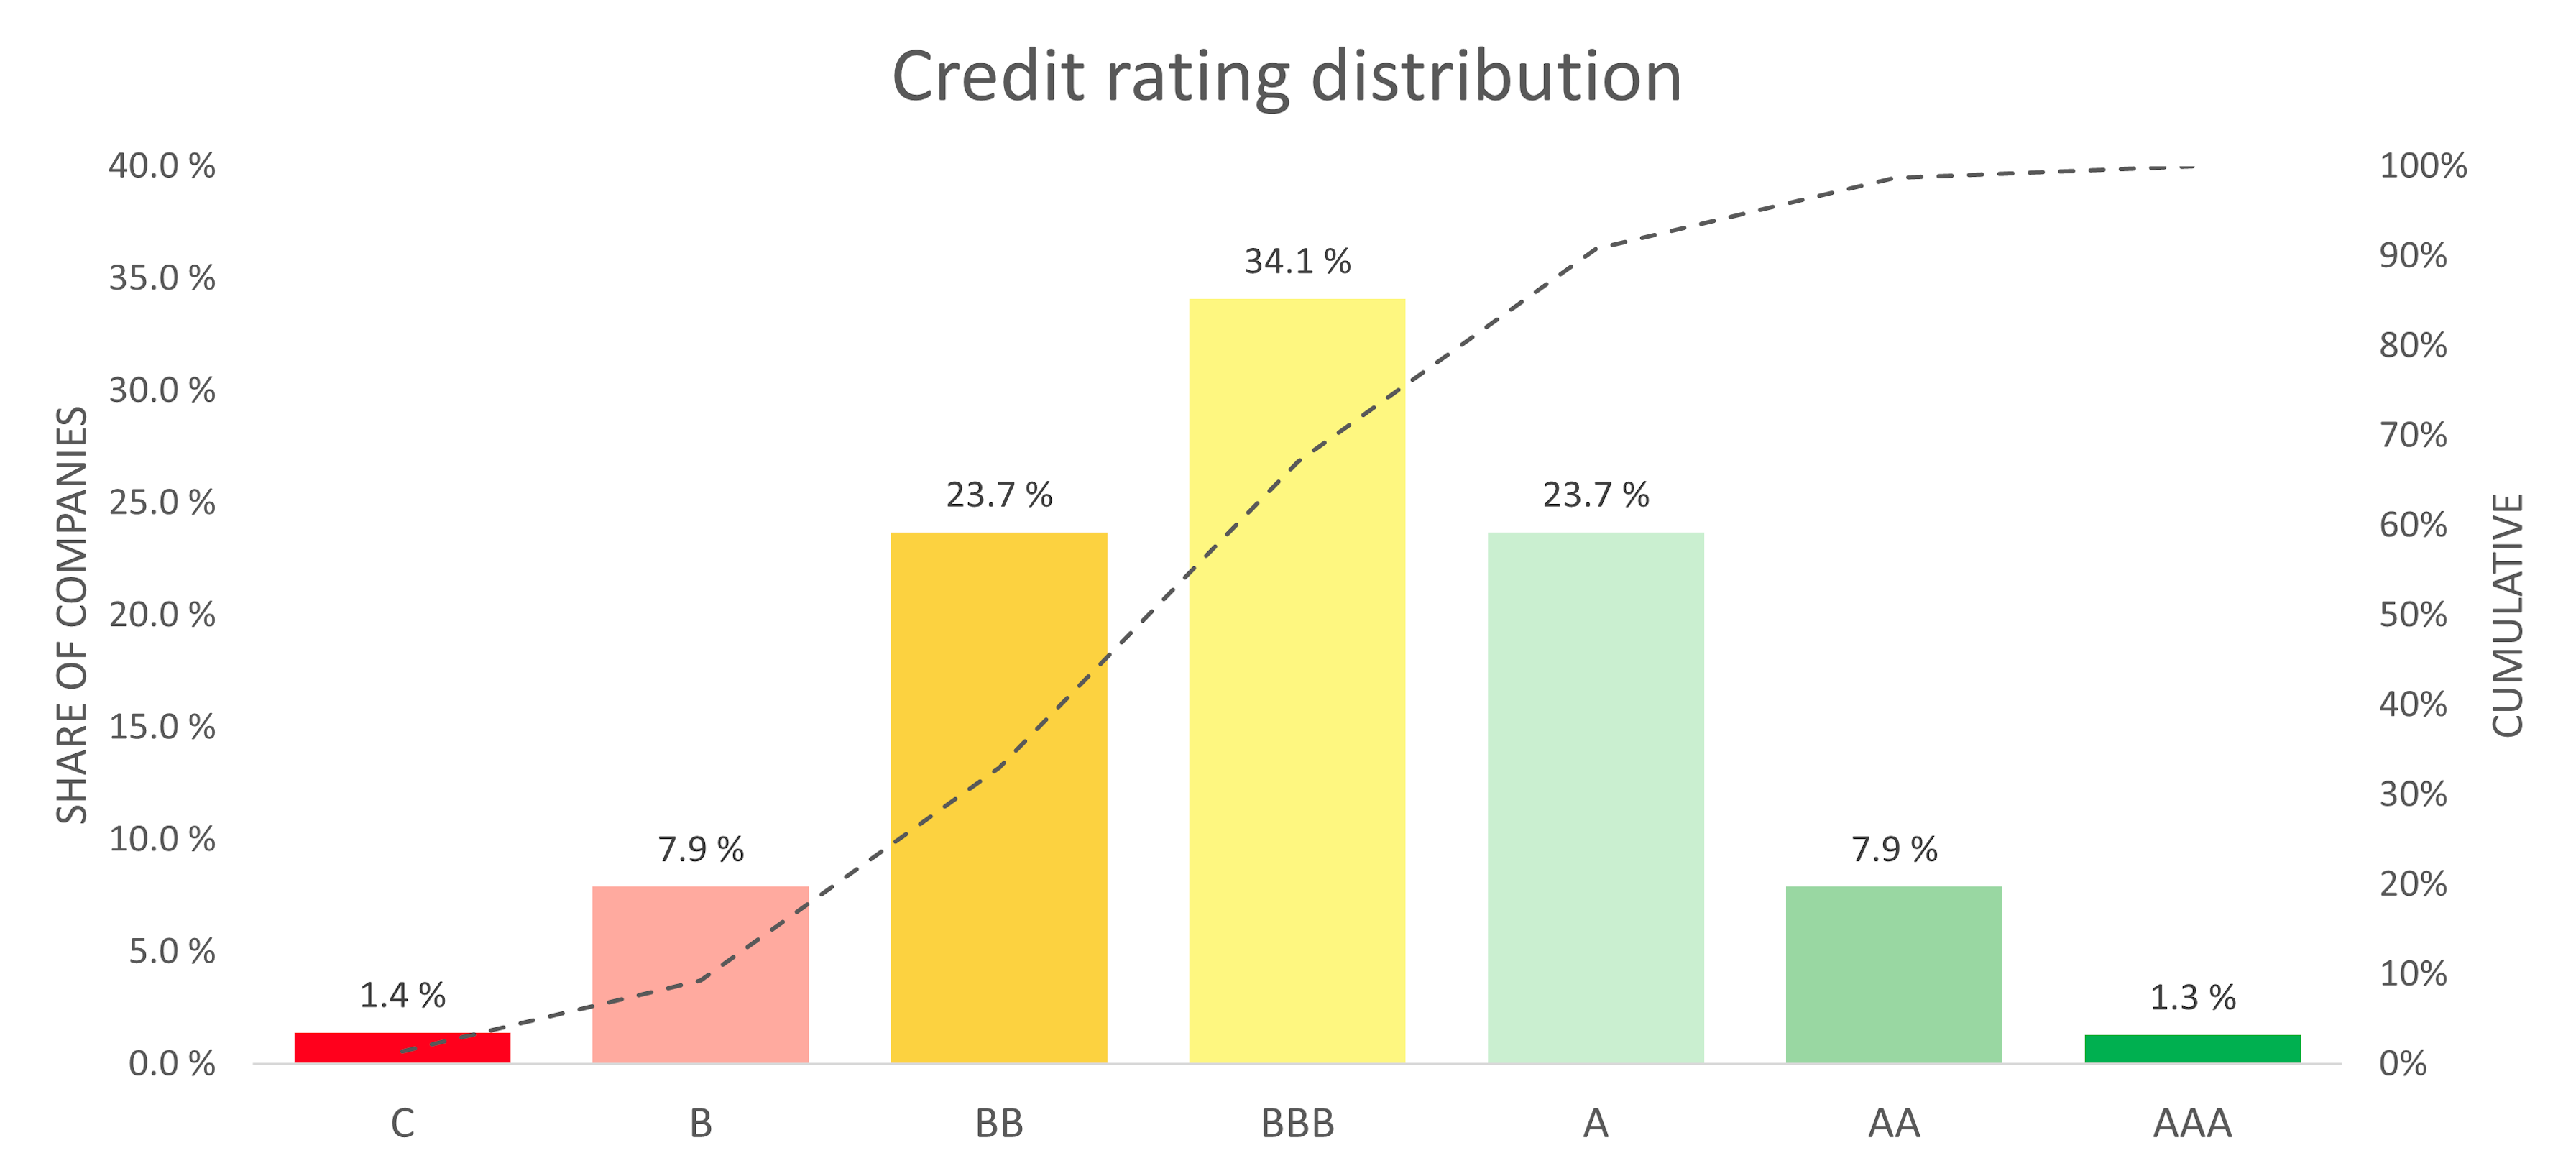
Kreditvurdering is a way to classify companies into larger groups, making it easy to quickly compare a given company to all the others in our database. Ratings are derived directly from a company’s assessed bankruptcy risk: high-risk companies receive lower ratings, while low-risk companies receive higher ratings. We use a standard seven-tier scale from AAA to C, where AAA represents the lowest bankruptcy risk and C the highest. For example, companies at or above the 987th permille (or the top 1.3%) receive a ‘AAA’ rating, while those between the 334th and 667th permilles are rated ‘BBB’. The distribution of ratings across these categories is illustrated in the chart below.
Kreditvurderingen refers to a company’s risk relative to other companies. The value ranges from 0 to 100, and the higher the score the lower the risk. For example, a credit score of 78 means that the company in question has a lower risk than 78 % of all companies for that specific year. This score supplements the rating, as a rating class can cover a broad range of credit scores.
Konkursrisiko
Vores konkursrisiko probability assesses the likelihood of a company failing to meet its financial obligations and declaring bankruptcy within the next 24 months. Our current methodology involves the utilization of the XGBoost machine learning model, which incorporates approximately 30 explanatory variables for risk estimation. In our evaluations, XGBoost has consistently outperformed alternative approaches, including random forest. Notably, academic studies have also demonstrated the superior performance of machine learning models when compared to conventional logistic regression-based models. More on these in previous sections.
Kredit grænse
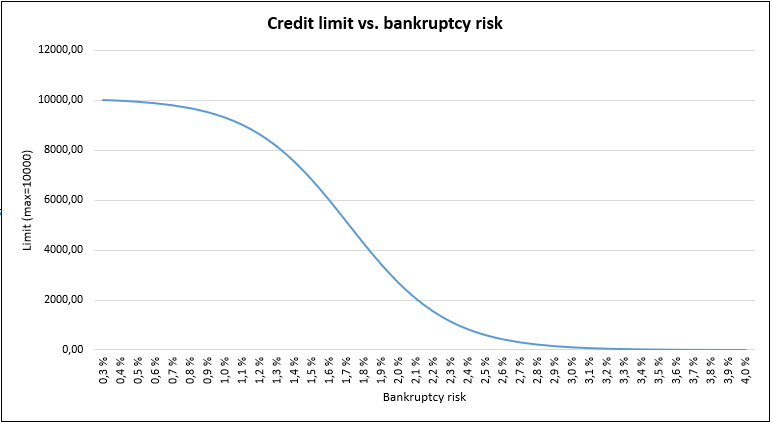
Vi tilbyder et foreløbigt estimat for en potentiel kreditgrænse, bestemt af en virksomhedsspecifik maksimumgrænse og den tilhørende konkursrisiko. Vores maksimalgrænseberegning tager højde for forskellige faktorer, såsom egenkapital og disponible likvide midler. Denne indledende maksimalgrænse justeres derefter baseret på virksomhedens konkursrisiko, som illustreret i grafen nedenfor. The graph below illustrates how this works, with a sample maximum limit set at 10,000 (for illustration only); in practice, larger companies may qualify for significantly higher limits than smaller ones.
Vær opmærksom på, at den kreditgrænse, vi tilbyder, er et estimat baseret på et begrænset sæt variabler og vurdering af konkursrisiko. Vi anbefaler kraftigt at foretage en omfattende evaluering af virksomhedens økonomiske status, før der træffes beslutninger vedrørende lånebeløbet.